Claude Motion: Create Editable AI Animations
Discover Claude Motion for editable animated explainers, Claude Dashboards for business data, and new Claude Docs, Slides and Design availability.
Source: https://claude.com/resources/articles/dashboards-and-motion
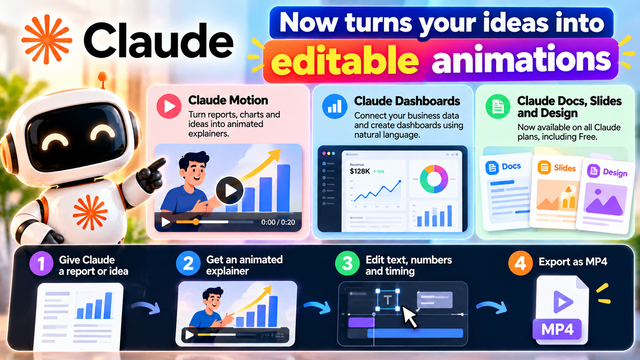
Claude Motion and Dashboards: How Anthropic Is Changing AI Content Creation
Anthropic has introduced two new beta features for Claude: Claude Motion, which creates editable animated explainers, and Claude Dashboards, which turns business data into dashboards using natural-language instructions. The announcement was published on October 8, 2026.
At the same time, Claude Docs, Slides and Design have moved out of beta and are available across Claude plans, including Free. These changes expand Claude beyond a conversational AI assistant into a workspace for creating documents, presentations, data visualizations and animations. Official announcement
For content creators, students, marketers, developers and businesses, the interesting part is not simply that Claude can create more content. It is that users can edit the output instead of starting again whenever they want to change a word, chart or design element.
Let's explore what these features do, who can access them and how creators might use them in real projects.
1. What is Claude Motion?
Claude Motion is a tool for creating animated explainers from ideas, reports, charts and other content.
Imagine you have a business report with several statistics. Normally, you might need a video editor, animation software, graphic assets and time to assemble a short explainer. With Claude Motion, you can describe what you want and ask Claude to build an animation.
For example, you could request:
"Create a 30-second animated explainer showing how artificial intelligence is changing small businesses. Include three statistics, animated charts, short captions and a clear conclusion."
Claude generates an animation that can be reviewed and edited. You can adjust it in the editor or ask Claude to make specific changes, then export the result as an MP4 video.
Possible applications include:
Animated explanations of technology news
Product walkthroughs for customers
Business presentations and internal updates
Animated charts for reports
Educational explainers for students
Short videos explaining a new product or service
The goal is to make information easier to understand through movement, timing and visual storytelling.
2. The important difference: animations built with code
One of the most interesting details is how Claude Motion creates its animations.
According to Anthropic, Motion writes code that animates text, charts, shapes and images. It does not use a video-generation model to create generated footage or AI-generated people.
Why does that matter?
Traditional video-generation tools often produce a complete video clip. If a small detail is wrong, you may need to regenerate the clip, edit around the mistake or create another version.
Claude Motion takes a different approach. Because the animation is built from code, individual elements can be changed. You can edit a word, replace a number or adjust timing without having to regenerate the entire animation.
For example, imagine an animated chart showing revenue growth.
You discover that the chart's title contains a typo. Instead of recreating the entire video, you can edit the title.
If a statistic changes, you can update the number. If the animation moves too quickly, you can adjust its timing.
This approach is especially useful for explainers where accuracy and readability matter more than realistic video footage.
However, editable animation is not the same as fully generated cinematic video. Claude Motion is designed primarily for explaining information and presenting ideas, rather than generating realistic scenes with actors, locations or complex physical action.
3. Can Claude Motion export videos?
Yes. Anthropic says users can download Claude Motion animations as MP4 files.
MP4 is a widely supported video format that works with many video editors, presentation tools and social platforms.
A creator could therefore use Claude Motion to build an initial animated explainer, export it, and then make additional edits in a compatible editor.
Anthropic also lists integrations or handoff options involving tools such as Adobe, Descript, HeyGen, Higgsfield, InVideo, Luma AI and Runway, with Canva and Captions described as coming soon in the announcement.
This creates an interesting workflow: use Claude to build the animation and use other tools for additional production, depending on the project.
Still, creators should check the export settings, dimensions, text readability and platform requirements before publishing. A video that looks good in an editor may need adjustments for a vertical Reel, a YouTube video or a presentation screen.
4. Claude Dashboards: business data in plain language
Claude Dashboards focuses on a different problem: understanding business data.
Businesses often store information in databases, data warehouses and customer relationship management systems. To answer a simple question, an employee may need to request a report, write a database query or wait for an analytics team.
Claude Dashboards aims to make some of these tasks easier.
Users can connect supported data platforms or apps and describe what they want to understand in ordinary language. Claude then builds a dashboard from the connected data.
For example, a business owner could ask:
"Show this month's sales by region and compare the results with last month."
A marketing team might ask:
"Create a dashboard showing weekly website signups, separated by marketing channel."
A sales manager could request:
"Show our open sales opportunities by stage and responsible team member."
Claude can create charts and answer exploratory questions about the connected information. Each chart exposes the query behind it, and users can see when its data was last refreshed. This helps people inspect how a result was calculated rather than treating every number as unexplained output.
The feature is intended to complement business intelligence and analytics tools, not automatically replace every advanced reporting or data-science workflow.
5. Who can access these new features?
Availability is an important detail because not every feature is included in every Claude plan.
Claude Motion: Beta access is available on Team and Enterprise plans.
Claude Dashboards: Beta access is available on paid plans, including Pro, Max, Team and Enterprise. Enterprise administrators may need to enable it.
Claude Docs, Slides and Design: These features are available across Claude plans, including Free. Enterprise administrators may control when they are enabled for their organization.
This means that users on the Free plan should not assume they can access Claude Motion or Dashboards simply because they can use Claude Docs, Slides and Design.
Feature availability can also depend on organization settings and account capabilities. Check the official Claude Artifacts Help Center for the current details.
6. What has changed for Claude Docs, Slides and Design?
The announcement is not only about Motion and Dashboards.
Anthropic has also removed the beta label from Claude Docs, Slides and Design and made these features available on every Claude plan, including Free.
These tools support different types of work.
Claude Docs helps users create and edit documents.
Claude Slides helps turn notes, reports and other material into presentations.
Claude Design supports visuals, mockups, prototypes and other design work.
Anthropic also describes improvements for collaboration, sharing and exporting. Presentations can be exported to PowerPoint or PDF, and decks can be sent to Google Slides as editable files.
These capabilities could help students prepare presentations, professionals organize reports and creators develop visual assets without switching between multiple tools for every task.
The output still needs human review. A presentation can look polished while containing incorrect figures, missing context or weak arguments. Always verify important information before sharing it.
7. How Indian creators can use Claude Motion
For Indian creators who publish AI tutorials, technology updates and educational Reels, Motion offers a potential way to turn written information into more visual content.
Consider a creator covering a new AI tool.
First, the creator collects the official announcement and identifies the most important facts. Next, they ask Claude to create a short animated explainer with a headline, three key points and a conclusion. They can then correct the text, change the timing and export the animation.
A simple workflow could look like this:
Step 1: Choose a topic. Pick a useful subject, such as a new AI feature, a technology concept or a business trend.
Step 2: Prepare accurate information. Gather verified facts and separate confirmed details from speculation.
Step 3: Write an animation prompt. Describe the audience, duration, visual style, text and sequence of scenes.
Step 4: Generate the animation. Ask Claude Motion to create an explainer from your material.
Step 5: Review every element. Check spelling, statistics, labels, transitions and timing.
Step 6: Export and finish. Download the MP4 and make any additional edits needed for the target platform.
For a 20-second Reel, a creator might use a short opening hook, two or three visual explanations and a final takeaway. The exact length and layout should be tested in the editor rather than assumed to be a guaranteed preset.
The biggest advantage is the ability to update individual elements during revisions.
8. A sample prompt for an animated AI news explainer
Creators can start with a prompt like this:
"Create a short animated explainer about the latest AI technology announcement. Start with a strong headline, then show three key facts using clear animated text and simple charts. Use high-contrast colors, readable typography and smooth transitions. Keep the wording concise, highlight the most important detail and finish with a one-sentence takeaway. Make every text element and number editable. Do not invent statistics or claims. Use only the information provided below."
Then paste the verified news details.
This is a starting point, not a guarantee that every animation will follow the requested format perfectly. Review the result and refine it before publishing.
For PromptMandi-style content, the animation could be paired with a separate thumbnail, a short social caption and a link to the original announcement. This gives the audience a quick visual summary while preserving a path to the source.
9. How students and businesses could benefit
The applications extend beyond social media.
Students: An abstract subject can be easier to understand when explained through an animated sequence. Students could explore visual explanations of algorithms, statistics, economics or scientific concepts, then correct and adapt the material for presentations.
Teachers and trainers: Animated explainers can introduce a topic before a lesson or summarize the most important ideas afterward.
Small businesses: A company could turn a product explanation, monthly performance summary or onboarding process into a concise visual presentation.
Marketing teams: Teams could test different ways of explaining a product, service or campaign without manually rebuilding every animation element.
Data and operations teams: Dashboards may help people explore connected business information and ask follow-up questions without beginning every task with a manually written query.
These are possible applications rather than guarantees of better learning, engagement or business results. The quality of the output still depends on the source material, the prompt and the user's review.
10. Limitations and things to check
Although these features can reduce some manual work, they do not remove the need for judgment.
First, access is plan-dependent. Motion and Dashboards are beta features with more limited availability than Docs, Slides and Design.
Second, an animation built from code is not a substitute for realistic AI-generated video footage. Its strength is editable visual explanation.
Third, the quality of a dashboard depends on the underlying data, the connected source and the question being asked. A well-designed chart can still be misleading if the source data is incomplete or the query does not match the intended meaning.
Fourth, creators should verify claims and statistics. AI-generated text, charts and animations should not be treated as automatically accurate.
Finally, businesses should follow their organization's rules for data access. Connecting a business data source to an AI tool requires careful attention to permissions, confidentiality and approved usage.
Final takeaway
Anthropic's Claude Motion and Claude Dashboards introduce two different ways to work with information: turn ideas into editable animations, or explore connected business data through dashboards described in natural language.
Motion stands out because its animations are built with editable code and can be exported as MP4 files. Dashboards focuses on making data exploration more accessible. Meanwhile, Docs, Slides and Design are now generally available across Claude plans, including Free.
For Indian creators, students and businesses, the best approach is to experiment with a small, useful project first. Verify the information, check your plan's access, edit the result carefully and measure whether the new workflow genuinely saves time.
Official source: Build live dashboards and animate explainers with Claude — Anthropic, October 8, 2026.